.png)
Learn how to leverage logistics performance metrics to optimize your supply chain efficiency. Discover our expert tips today!
Think of logistics performance metrics as the vital signs for your supply chain. They are the specific numbers you track to get a clear, honest picture of how efficiently, cost-effectively, and reliably your operations are running. These aren't just abstract data points; they're your report card, showing you exactly what’s working and, more importantly, where you can improve.
Ever tried driving to a new place without a map or GPS? You might get there eventually, but you'll probably waste a ton of time, fuel, and patience making wrong turns. Running your supply chain without tracking logistics performance metrics is pretty much the same thing—you're just guessing and hoping for the best.
These metrics are your data-driven roadmap. They guide you through the complex journey of getting goods from point A to point B, transforming vague goals like "get better" into concrete targets you can actually hit. When you monitor the right numbers, you can catch small hiccups before they snowball into costly disasters and make smart decisions backed by real evidence, not just a gut feeling. If you'd like to dive deeper, we have a complete guide on how to improve supply chain efficiency using these insights.
This image really breaks down how different metrics work together to give you a full operational overview.

As you can see, the big picture of your logistics performance is really built on the success of specific areas like on-time delivery, order accuracy, and how well you manage your inventory.
Let’s get practical. Without keeping a close eye on your KPIs, you might not notice your "on-time" delivery rate has dipped from 98% to 92% this quarter. It sounds like a small drop, but that 6% difference can lead to a surge in unhappy customers and a drop in repeat business. By tracking that metric, you can immediately dig into the why—is it a problem with a carrier, a bottleneck in the warehouse, or poor route planning?—and fix it.
Tracking logistics metrics isn't just about collecting data; it's about telling the story of your supply chain's health. Each number reveals a chapter about your costs, your speed, and your customer's happiness.
Ultimately, these numbers give you the clarity you need to run a tighter ship. They help you answer the make-or-break questions that fuel growth:
Knowing the answers is the first step toward getting better. It doesn't matter if you're shipping full truckload (FTL) or less-than-truckload (LTL); your numbers are everything.
Every supply chain has two sides to its story: what comes in and what goes out. To really get a grip on your operations, you need to measure the performance of both. Think of it like a busy restaurant kitchen—the quality and timing of ingredients arriving (inbound) have a direct effect on how quickly and accurately meals are served to hungry customers (outbound).
Let's break down the essential metrics you should be watching on both sides of your warehouse doors. These numbers don't just give you data; they tell you the story of your operational health.
Inbound logistics covers the entire journey of materials and goods from your suppliers right to your facility. Getting this part right is crucial. A hiccup here can create a domino effect, throwing off production schedules and leading to frustrating stockouts down the line.
Here are the vital signs you need to monitor for your inbound flow:
Keeping a close eye on these numbers helps you build a much more predictable and resilient supply chain right from the very start.
Outbound logistics is where the rubber meets the road—it’s the part of your operation that your customer actually sees and feels. Performance here can make or break customer loyalty. These metrics are all about getting the right product to the right person, on time, and in perfect condition.
The Perfect Order Rate is the ultimate report card for your outbound success. It measures the percentage of orders delivered on time, complete, with the correct items, and with zero damage. Even a tiny improvement in this single metric can have a huge ripple effect on customer happiness.
Hitting a high perfect order rate isn’t about acing one thing; it’s about excelling across several interconnected areas.
If you had to pick just one outbound metric to obsess over, it would be On-Time Delivery (OTD). It measures the percentage of orders that reach the customer by the promised date. This is a direct measure of your reliability and a massive driver of customer retention.
A consistently high OTD rate builds trust. A poor one sends customers straight to your competition. The importance of timeliness is seen on a global scale, too. Analysis shows that top-performing countries, with logistics scores exceeding 85% for on-time arrivals, see their export growth rates jump 1.5 to 2 times higher than those at the bottom.
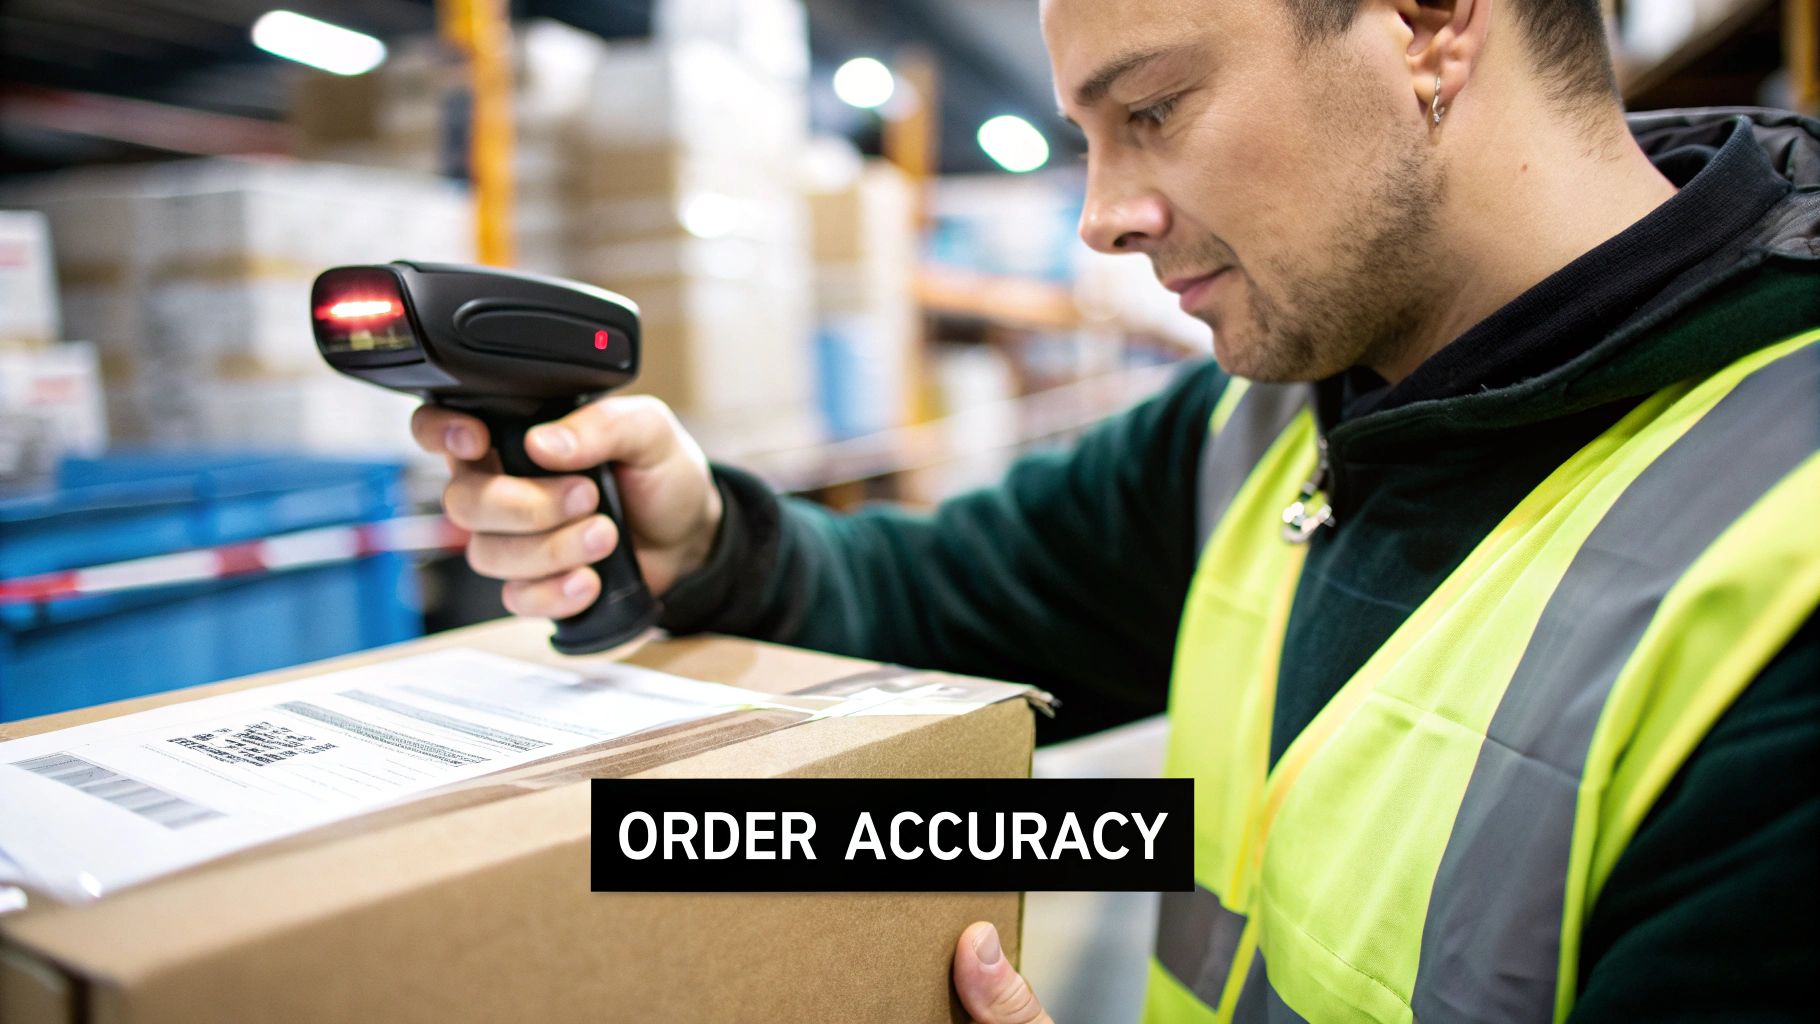
Right alongside OTD is Order Accuracy. This tracks the percentage of orders you ship without a single mistake—the right items, the right quantities, and the right address.
Think about it from the customer's perspective. They’ve been eagerly waiting for their package, only to open it and find the wrong item. That frustration and the hassle of a return can instantly undo all the goodwill you've built. High order accuracy is one of the best ways to minimize costly returns and keep your customers happy.
Partnering with an expert can be a game-changer for improving these numbers. You can learn more about the benefits of using a third-party logistics (3PL) provider to see how.
None of these metrics live on an island. They're all connected, and together they paint a full picture of your supply chain's health.
For example:
By tracking both inbound and outbound metrics, you get a 360-degree view. It allows you to find the root cause of a problem, not just treat the symptom, and make smart changes that strengthen your entire operation from end to end.
Beyond the trucks and highways, the real heart of your logistics operation is beating inside your warehouse. This is where success is often won or lost—not in miles traveled, but in minutes saved and space optimized.
Think of your warehouse like a busy grocery store. You have to keep the shelves stocked with what customers want, all while making sure the fresh produce doesn't spoil in the back room. Getting this balance right is what warehouse and inventory health is all about, and these logistics performance metrics have a massive impact on your cash flow and customer happiness.
This is where you can catch problems before they ever hit the road. By tracking a few key numbers, you can turn your inventory from a potential liability into one of your most powerful assets. Let’s dive into the metrics that tell the true story of what's happening inside your four walls.
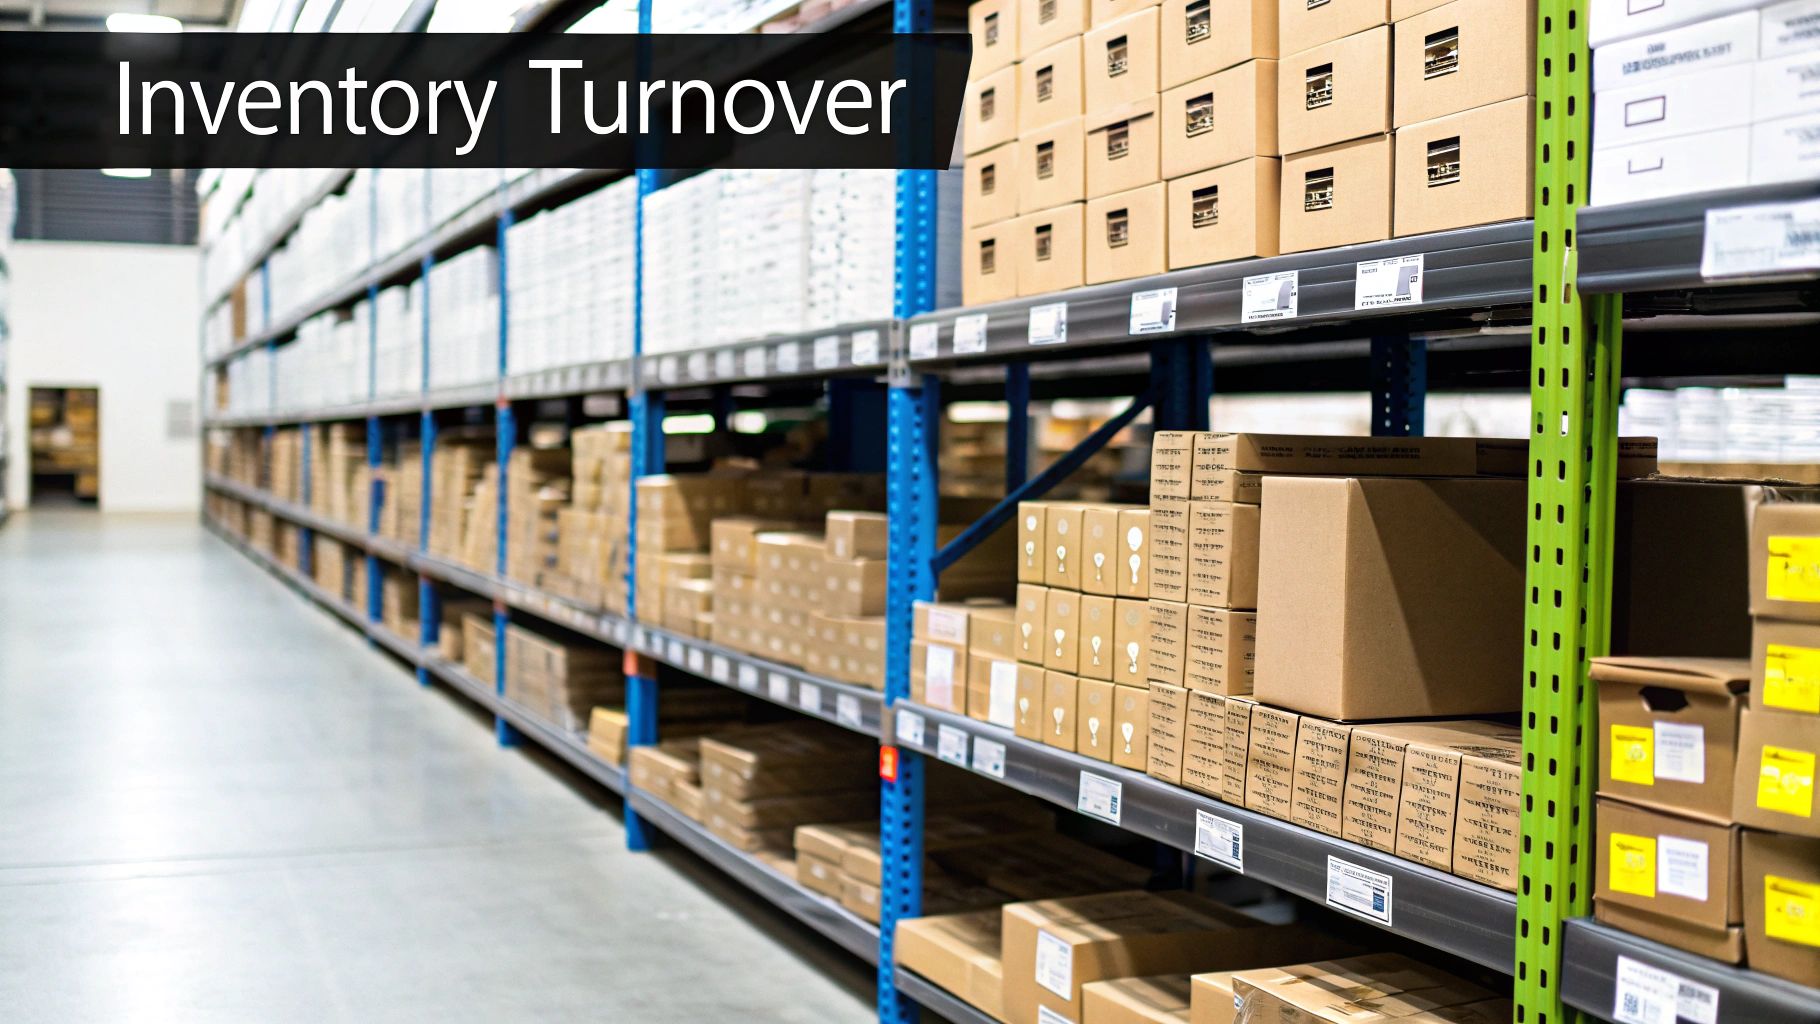
Imagine you have two piles of cash. One is sitting untouched in a vault, and the other is constantly being invested and returned with a profit. Which one is more valuable? Inventory works the exact same way. The Inventory Turnover Ratio is a simple but powerful metric that shows you how many times you sell and replace your entire inventory over a specific period.
A high turnover ratio is a great sign. It means you have strong sales and aren't tying up money in products that just sit there. On the flip side, a low ratio suggests your goods are collecting dust, which leads to "dead stock"—like that forgotten produce in our grocery store example. This isn't just an abstract number; improving your turnover rate is like freeing up cash to reinvest in your business.
What does it really cost to hold onto your products? That’s what Inventory Carrying Costs tell you. This metric goes way beyond the simple purchase price of your goods. It’s a percentage that bundles together all the hidden expenses of storing unsold inventory.
These costs typically include:
Tracking carrying costs reveals the true financial burden of slow-moving stock. It’s not uncommon for businesses to find these costs add up to 20-30% of their inventory's total value each year, silently eating into profits.
Once you understand these expenses, you can see the real financial impact of your inventory decisions. Reducing carrying costs, often by improving your turnover, directly boosts your bottom line.
Your warehouse isn't just a building; it's a valuable, finite asset. Space Utilization is all about measuring how efficiently you're using your storage area. The goal here is to make the most of your cubic space—length, width, and height—without creating a cluttered mess that slows everyone down.
When space utilization is poor, you're basically paying for empty air. This can lead to disorganized stock, longer travel times for your pickers, and even make you think you need a bigger, more expensive facility when you don't. A well-organized warehouse, on the other hand, improves picking accuracy and speed, which has a direct impact on your outbound logistics performance.
By keeping a close eye on these three core metrics, you get a clear, data-backed picture of your operational health. They show you how to avoid costly dead stock, prevent frustrating stockouts, and turn your warehouse into a streamlined, profit-driving machine at the center of your supply chain.
Operational wins are great, but they don't really move the needle until you can show how they impact the company's financial health. This is where you translate efficiency gains and on-time deliveries into the language everyone in the C-suite understands: dollars and cents. The right financial logistics performance metrics build a powerful bridge between your day-to-day supply chain activities and the company's bottom-line profitability.
Tracking these numbers is how you prove your department’s value and start making smarter, more strategic decisions. It’s the difference between saying "we're shipping faster" and proving that "our new shipping process cut costs by 12% last quarter." One is a nice observation; the other is a compelling business case.
One of the most direct ways to tie logistics to the balance sheet is by calculating the Freight Cost Per Unit. This metric tells you exactly how much it costs to transport a single item, whether that’s a pallet, a case, or an individual product. It’s a beautifully simple KPI that cuts right through the noise of overall freight spend.
Let's say you spent $5,000 on a full truckload that was carrying 2,000 units. A quick calculation shows your freight cost per unit is $2.50. Knowing this number is incredibly powerful. It helps you price your products accurately, truly understand your profit margins, and pinpoint which product lines are the most expensive to get out the door.
To see the bigger picture, you need to track your Transportation Costs as a Percentage of Revenue. This metric shows you exactly what slice of your total sales is being eaten up by the cost of getting products to your customers. It’s a vital sign for the financial efficiency of your entire supply chain.
Imagine your total revenue for the month was $500,000, and you spent $35,000 on transportation. Your transportation cost as a percentage of revenue would be 7%.
By keeping an eye on this percentage over time, you can spot trends before they become problems. If your revenue is growing but this percentage is climbing even faster, it could be a red flag for rising carrier rates, inefficient routing, or poor load optimization that needs immediate attention.
This single KPI is absolutely essential for budgeting. It helps you set realistic cost-reduction goals that actually align with the company's overall financial targets.
Simply knowing these financial metrics is just step one. The real magic happens when you start using them to make strategic choices. These numbers give you the hard data you need to justify decisions and uncover hidden opportunities for savings.
For example:
These metrics are fundamental to running a lean, effective operation. For a deeper dive into how these pieces fit together, check out our guide on the fundamentals of supply chain management. When you learn to speak the language of finance, you can clearly demonstrate that a well-run logistics department isn't just a cost center—it's a powerful engine for profitability.
Let's be honest, the days of tracking shipments on a massive spreadsheet and hoping for the best are long gone. Thank goodness. Technology has completely flipped the script on how we measure logistics, moving us from a world of putting out fires to one where we can see problems coming and sidestep them entirely.
We're not just doing the same old things faster; we're gaining insights and capabilities that simply weren't possible a decade ago.
This whole shift is being driven by a new wave of digital tools. Modern logistics software acts like a central command center for your entire supply chain, pulling in data from every corner, making sense of it, and serving it up in a way that helps you make smart calls on the fly.
Leading the charge are a few key pieces of tech. You’ve probably heard of Transportation Management Systems (TMS), which are the brains behind your shipping operations. A good TMS handles everything from picking the right carrier to mapping the most efficient routes, giving you a crystal-clear view of freight costs and delivery times.
Then you have Warehouse Management Systems (WMS). Think of a WMS as the air traffic controller for your warehouse, orchestrating the movement of every single item to maximize space, keep inventory accurate, and get orders out the door without a hitch.
These systems do more than just automate tasks—they become your single source of truth. They cut out the manual data entry errors we're all guilty of and give you clean, reliable data for your logistics performance metrics.
Technology transforms metrics from historical report cards into live, actionable intelligence. Instead of finding out about a late delivery after a customer complains, you can see the delay brewing and jump in before it becomes a problem.
Having that real-time visibility is a game-changer. It doesn't matter if you're juggling complex FTL freight or coordinating a dozen LTL shipments; the right technology gives you a level of control that was once unimaginable.
But the real leap forward? That comes from AI-powered analytics. These sophisticated systems are like having a team of analysts working 24/7, digging through mountains of data to spot trends and predict what’s coming next.
For instance, an AI tool can look at your past shipping data, cross-reference it with weather forecasts and real-time traffic, and flag a shipment that’s at high risk for a delay. It might even suggest a better route before the truck even leaves the dock.
This is how you get ahead of the curve—anticipating demand surges, preventing stockouts, and building a supply chain that can handle whatever gets thrown at it. This isn't just a niche trend; it's happening everywhere. If you look at the big picture, you'll see that global logistics have been getting steadily better, and a big reason is the widespread adoption of digital tracking and automation. You can see some of that progress in the data on how digital tools are boosting global logistics performance.
By bringing these tools into your operation, you're not just keeping up with the times. You're building a smarter, leaner, and more resilient future.
Jumping into the world of logistics performance metrics can feel a bit like learning a new language. You're bound to have a few questions. We've pulled together some of the most common ones we hear to help you get started with confidence.
The honest answer? It depends entirely on what you're measuring and why. It's kind of like checking on your car—some things you glance at every day, others only need a look every few months.
Metrics that steer your day-to-day work, like On-Time Shipping or order picking accuracy, need constant attention. Think daily or weekly check-ins. On the other hand, bigger-picture numbers like Inventory Turnover or your total freight spend are better reviewed monthly or quarterly. This gives you enough data to see the real trends, not just the daily noise.
It's tempting to want to measure everything at once, but that's a quick way to get overwhelmed. If you're just starting out, zero in on the metrics that pack the biggest punch for your customers and your bottom line.
We always recommend starting with these three essentials:
Get these three down, and you'll have a fantastic foundation to build on.
Curious how your freight costs compare to the market? Let's find out.
The best metrics aren't found on a generic list—they're tied directly to your business goals. Never track a KPI just for the sake of it. Each one should give you a clear signal about something that truly matters.
Think of your logistics metrics as a compass. They should always point directly toward what you're trying to achieve as a business. If your goal is to be the fastest shipper, measure speed. If it's to be the most affordable, measure cost.
Start by defining what "success" looks like for your company. Is it dramatically cutting transportation costs? Seeing your customer satisfaction scores soar? Or maybe it's all about becoming the fastest delivery option in your niche.
Once you know your destination, the right metrics will light up the path to get you there.